Why Python for Data Analysis?
Python didn't become the industry standard for data work by accident. A few reasons stand out:
| Reason | Why It Matters |
| Simple, readable syntax | Easier for beginners to learn compared to many other programming languages |
| Powerful data libraries | Pandas, NumPy, and others handle heavy lifting with minimal code |
| Huge community support | Answers to almost any problem are already documented online |
| Works across the full pipeline | From cleaning data to building visualizations to machine learning, all in one language |
Essential Python Libraries for Data Analysis
You don't need to learn dozens of tools — just a handful of libraries cover most real-world data analysis work:
| Library | Purpose |
| Pandas | Loading, cleaning, and manipulating structured data (tables, spreadsheets) |
| NumPy | Fast numerical operations and array handling |
| Matplotlib | Creating basic charts and graphs |
| Seaborn | Building more polished, statistical visualizations with less code |
Step-by-Step Data Analysis Process Using Python
Here's the general workflow most analysts follow:
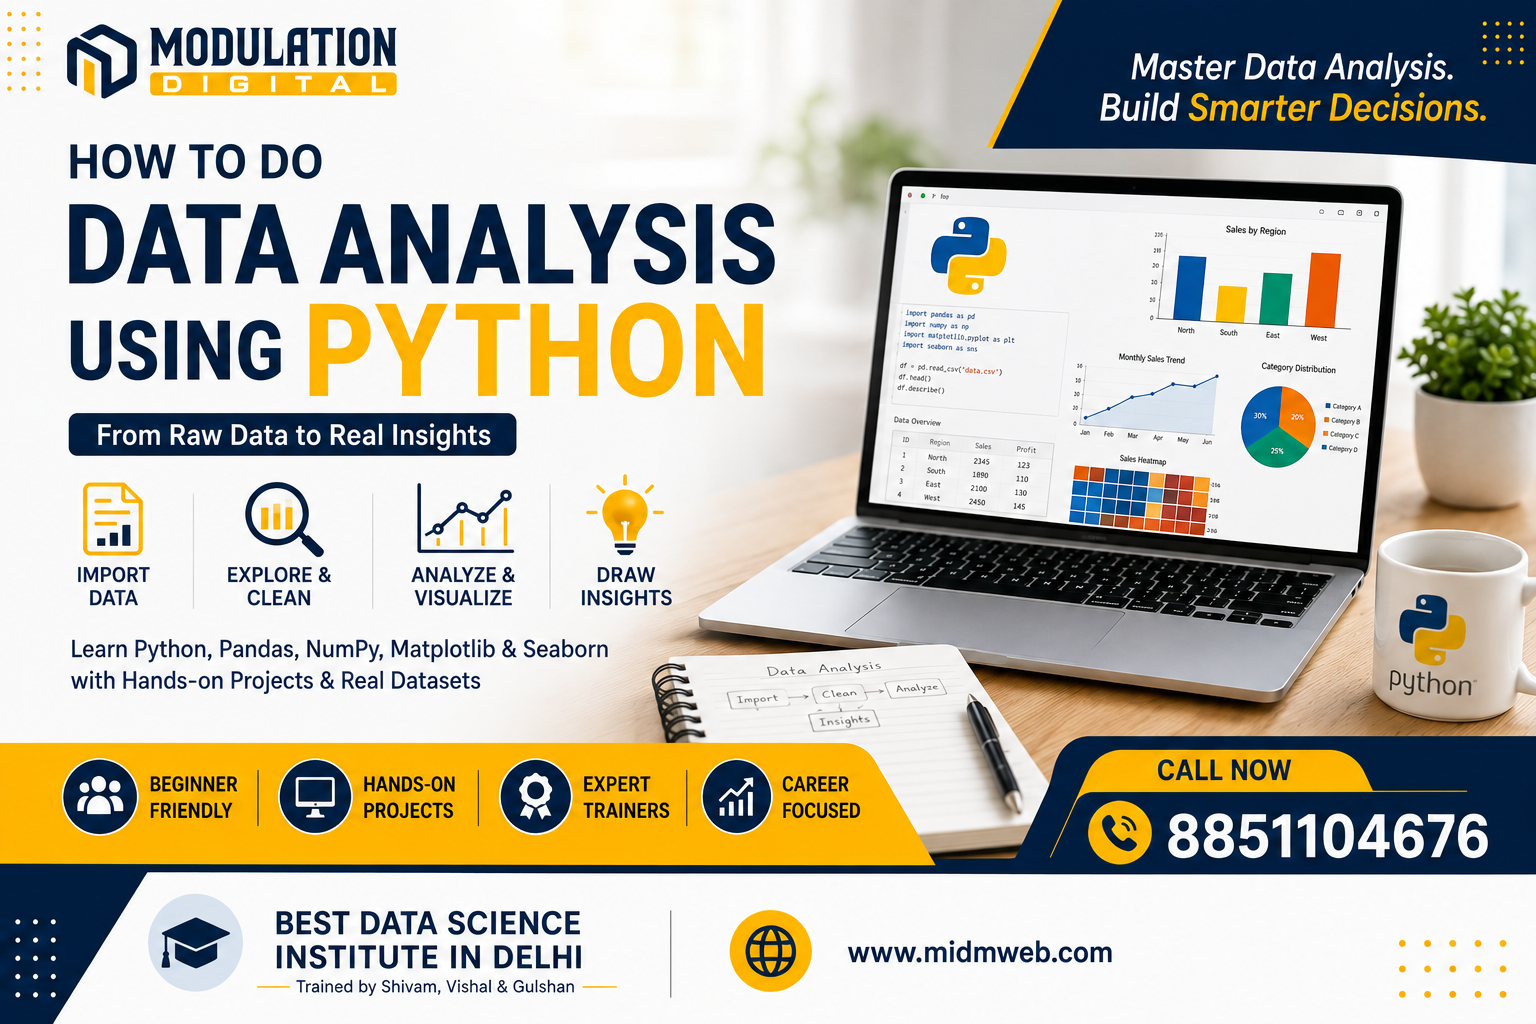
- Import the data — load a CSV, Excel file, or database table into Python using Pandas
- Inspect the data — check the first few rows, column names, and data types to understand what you're working with
- Clean the data — handle missing values, remove duplicates, and fix inconsistent formatting
- Explore the data — calculate averages, totals, and patterns to understand the bigger picture
- Visualize findings — turn numbers into charts that are easier to interpret at a glance
- Draw conclusions — summarize what the data actually tells you, in plain language
Quick Insight: Most beginners rush straight to step 5, skipping proper cleaning in step 3 — and end up with visually nice charts built on messy, unreliable data.
A Simple Example Walkthrough
Imagine you have a spreadsheet of monthly sales data and want to understand performance trends. Here's roughly how the process unfolds:
- Load the file — pandas.read_csv("sales_data.csv") pulls the spreadsheet into Python
- Check for missing values — .isnull().sum() quickly shows which columns have gaps
- Calculate totals — .sum() or .mean() gives quick totals or averages per column
- Group by category — .groupby("region") breaks down sales by region for comparison
- Plot the result — a simple bar chart shows which region performed best at a glance This entire process, which might take hours manually in a spreadsheet, often takes just a few lines of Python code once you're comfortable with the basics.
Common Data Cleaning Techniques in Python
Real-world data is rarely clean, so these techniques come up constantly:
| Technique | What It Solves |
| Handling missing values | Filling gaps with averages or removing incomplete rows |
| Removing duplicates | Cleaning up repeated entries that skew analysis |
| Fixing data types | Converting text-formatted numbers or dates into usable formats |
| Standardizing text | Fixing inconsistent capitalization or spacing in category names |
Data Visualization — Turning Numbers into Insights
Raw numbers in a table rarely tell a clear story on their own. Visualization bridges that gap:
- Bar charts — great for comparing categories, like sales across different regions
- Line charts — ideal for showing trends over time, like monthly revenue
- Histograms — useful for understanding the distribution of a single variable
- Scatter plots — helpful for spotting relationships between two variables A well-chosen chart often communicates in seconds what a table of numbers would take minutes to explain.
Common Mistakes Beginners Make While Analyzing Data in Python
| Mistake | Why It's a Problem |
| Skipping data cleaning | Leads to inaccurate results, even with correct analysis logic |
| Ignoring outliers | A few extreme values can distort averages and mislead conclusions |
| Overcomplicating the code | Trying to use advanced techniques before mastering the basics |
| Not documenting steps | Makes it hard to explain or repeat the analysis later |
About Modulation Digital
Modulation Digital is built around practical, hands-on learning for data science and analytics. Students work directly with real datasets throughout their training, practicing the exact Python workflow covered in this guide rather than just watching demonstrations. Modulation Digital – Best Data Science Institute in Delhi (Trained by Shivam, Vishal & Gulshan)
Meet Your Trainers
Learning Python-based data analysis at Modulation Digital means training under three specialists:
| Trainer | Specialization | Experience |
| Shivam | Data Analytics | 5+ years |
| Vishal | Data Science | 14+ years |
| Gulshan | Data Science | 6+ years |
| Shivam focuses on the practical analytics side, teaching students how to use Python alongside tools like Excel and Power BI for real business analysis. | ||
| Vishal, with over a decade of industry experience, guides students through more advanced Python applications, including how analysis connects to predictive modeling. | ||
| Gulshan works closely with Vishal, helping students strengthen their hands-on Python coding skills through guided practice and real project work — making this Best Data Science Institute in Delhi a well-rounded place to learn both analytics and data science together. |
Frequently Asked Questions (FAQs)
1. Do I need prior programming experience to analyze data with Python?
No, Python is considered one of the more beginner-friendly languages, and many students start with zero coding background.
2. Is Pandas difficult to learn for beginners?
Not particularly — Pandas has a fairly intuitive structure, and most beginners get comfortable with its basics within a few weeks of regular practice.
3. Can I do data analysis in Python without knowing math deeply?
Yes, basic data analysis relies more on logical thinking than advanced mathematics, especially in the early stages.
4. What's the difference between NumPy and Pandas?
NumPy handles numerical arrays and calculations, while Pandas is built for working with structured, table-like data — they're often used together.
5. Do I need to learn Excel if I already know Python?
It still helps — many workplaces use Excel for quick tasks, and understanding both makes you more versatile.
6. How long does it take to become comfortable with Python for data analysis?
With consistent practice, most beginners can handle basic real-world datasets within 2 to 3 months.
7. Is Jupyter Notebook necessary for data analysis in Python?
It's not strictly necessary, but it's widely used because it lets you run code in small sections and see results immediately, which suits data exploration well.
8. Can Python handle large datasets efficiently?
Yes, especially with libraries like Pandas and NumPy, which are optimized for handling reasonably large datasets on standard computers.
9. What file formats can Python work with for data analysis?
Python can handle CSV, Excel, JSON, and even direct database connections, among many other formats.
10. Is Python better than Excel for data analysis?
They serve different needs — Excel is great for quick, small tasks, while Python handles larger, more complex, and repeatable analysis far more efficiently.
11. Do I need to memorize all Pandas functions to be good at this?
No, most professionals regularly look up specific functions as needed — understanding core concepts matters more than memorization.
12. What's a good first project to practice data analysis in Python?
Analyzing a simple dataset like personal expenses, sales records, or public datasets from sites like Kaggle makes a great starting point.
13. Can these Python analysis skills lead to a data science career later?
Yes, many data scientists start with strong data analysis skills before adding machine learning and advanced statistics on top.
14. Is it necessary to learn data visualization along with data analysis?
Yes, being able to visualize findings clearly is a core part of communicating results effectively, not just a nice extra skill.
15. Once I've built something using Python, how do I turn it into a usable web application others can access?
That involves web development skills — specifically backend and full stack concepts. It's covered in detail in our other guide: Full Stack Development with Node.js: A Complete Guide
Conclusion
Data analysis using python isn't as intimidating as it might first appear — with the right libraries and a clear, repeatable process, even complete beginners can start pulling real insights from data within a few weeks of consistent practice. The key is building strong fundamentals before jumping into more advanced techniques. If you're ready to learn this properly, Modulation Digital, a trusted Best Data Science Institute in Delhi, offers structured training under experienced mentors across both data analytics and data science. Reach out today to book a free counselling session.