What is Excel Used For in Data Analysis?
Excel is a spreadsheet tool used for organizing, calcul ating, and analyzing data through formulas, pivot tables, and basic charts. It's widely used for smaller datasets, quick calculations, financial modeling, and situations where flexibility and manual control matter more than automation.
What is Power BI Used For?
Power BI is a business intelligence tool designed for building interactive dashboards and visual reports, often connecting directly to live data sources. Instead of manually updating numbers, Power BI can refresh automatically, making it especially useful for ongoing business reporting rather than one-time analysis.
Key Differences at a Glance
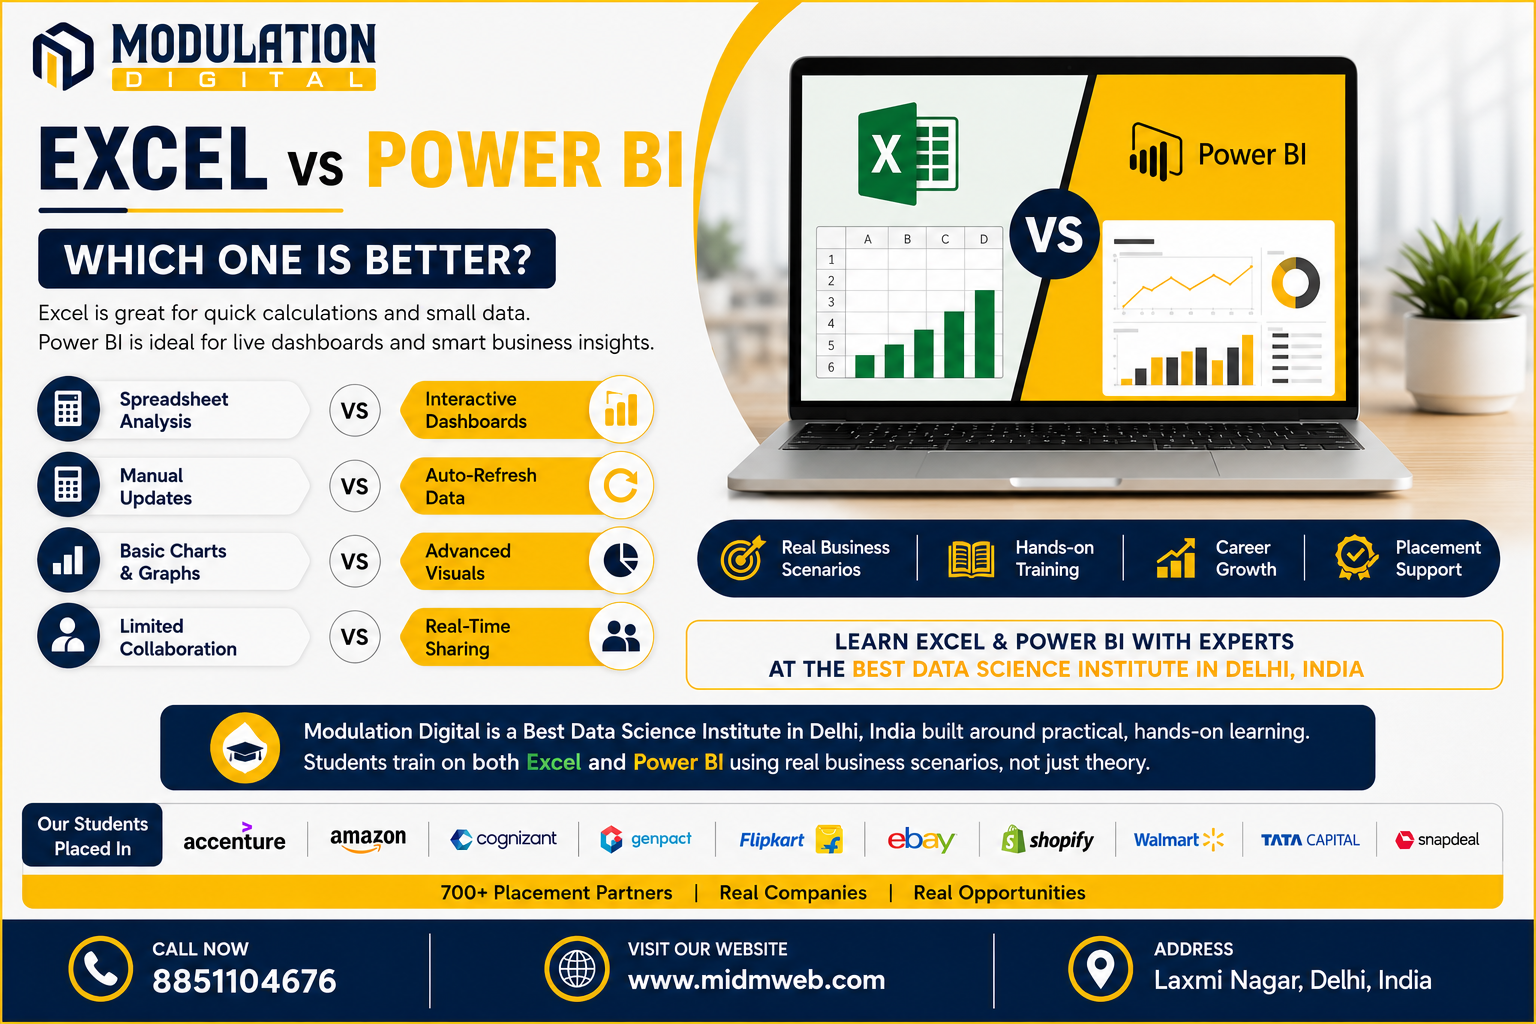
Here's a side-by-side breakdown to make this comparison easier to understand:
| Aspect | Excel | Power BI |
| Primary Purpose | Spreadsheet calculations and analysis | Interactive dashboards and business intelligence |
| Data Volume Handling | Struggles with very large datasets | Handles large datasets more efficiently |
| Automation | Mostly manual updates | Can auto-refresh from connected data sources |
| Visualization | Basic charts and graphs | Advanced, interactive visualizations |
| Learning Curve | Familiar to most office workers | Requires learning new concepts and interface |
| Collaboration | Limited real-time sharing features | Built for sharing live dashboards across teams |
When Should You Use Excel Instead of Power BI?
Excel remains the better choice in several situations:
- Quick, one-off calculations — when you just need a fast answer, not a full dashboard
- Small datasets — Excel handles smaller data comfortably without extra setup
- Highly custom formulas — Excel's flexibility for unique, ad-hoc calculations is hard to beat
- When recipients don't have Power BI access — Excel files remain universally accessible
When Should You Use Power BI Instead of Excel?
Power BI becomes the stronger choice when:
- Data updates frequently — automatic refresh saves significant manual effort
- Multiple people need to view the same live dashboard — sharing is far easier and more controlled
- Data volume is large — Power BI handles bigger datasets more smoothly than Excel
- Visual storytelling matters — interactive charts communicate insights faster than static spreadsheets
Can Excel and Power BI Work Together?
Yes, and in practice, many professionals use both rather than choosing one exclusively. Excel is often used for initial data cleaning, quick calculations, or smaller ad-hoc analysis, while Power BI takes over for ongoing reporting and dashboards meant for wider audiences. Power BI can even import Excel files directly, making the transition between the two fairly smooth.
Learning Curve — Which One Is Easier to Learn First?
Excel is generally easier to start with, since most people have some prior exposure to spreadsheets already. Power BI introduces new concepts like data modeling and DAX (Data Analysis Expressions) that take more time to get comfortable with. That said, learning Excel first often makes Power BI easier to pick up later, since many underlying data concepts carry over between the two.
Which Skill Do Employers Value More in 2026?
Rather than one replacing the other, most employers now expect familiarity with both. Excel remains essential for quick, flexible analysis, while Power BI has become increasingly expected for roles involving ongoing reporting and dashboard creation. Candidates who can comfortably use both tend to stand out more than those who rely on just one.
About Modulation Digital
Modulation Digital is a Best Data Science Institute in Delhi, India built around practical, hands-on learning. Students train on both Excel and Power BI using real business scenarios, rather than working through isolated, disconnected exercises.
Meet Your Trainers
Learning Excel, Power BI, and broader data skills at Modulation Digital means training under three specialists:
| Trainer | Specialization | Experience |
| Shivam | Data Analytics | 5+ years |
| Vishal | Data Science | 14+ years |
| Gulshan | Data Science | 6+ years |
Shivam leads Excel and Power BI training as part of the core analytics curriculum, helping students apply both tools directly to real business reporting scenarios.
Vishal, with over a decade of industry experience, helps students understand how dashboard-level insights connect to larger data science and predictive modeling workflows.
Gulshan works alongside Vishal, helping students strengthen their overall data handling skills through guided, hands-on practice across multiple tools.
Frequently Asked Questions (FAQs)
1. Do I need to learn Excel before Power BI? It's not mandatory, but prior Excel experience often makes learning Power BI's data concepts easier to grasp.
2. Is Power BI free to use? Power BI Desktop is free, though certain advanced sharing and collaboration features require a paid license.
3. Can Power BI completely replace Excel? Not entirely — Excel still remains useful for quick calculations and highly customized, ad-hoc analysis that Power BI isn't designed for.
4. Is Power BI difficult to learn for Excel users? It has a learning curve, especially around data modeling and DAX formulas, but familiarity with Excel definitely helps ease the transition.
5. Which tool is better for large datasets? Power BI generally handles large datasets more efficiently than Excel, which can slow down significantly with very large files.
6. Do companies expect candidates to know both tools? Increasingly yes, since Excel and Power BI often serve complementary roles within the same data analytics workflow.
7. What is DAX in Power BI? DAX, or Data Analysis Expressions, is the formula language used in Power BI for creating calculated fields and custom metrics.
8. Can I import Excel files directly into Power BI? Yes, Power BI supports direct import of Excel files, making it easy to bring existing spreadsheet data into a dashboard.
9. Is Power BI only useful for large companies? No, small businesses can also benefit from Power BI, especially once their reporting needs grow beyond what Excel comfortably handles.
10. What's the biggest advantage of Power BI over Excel? Its ability to create interactive, shareable dashboards that update automatically from connected data sources.
11. Is coding required to use Power BI? No traditional coding is required, though learning DAX formulas involves a syntax similar to formula-based logic.
12. Which tool should a beginner in data analytics start with? Starting with Excel is generally recommended, since it builds foundational data-handling skills before moving into more advanced tools.
13. Can Power BI connect to multiple data sources at once? Yes, Power BI can pull data from multiple sources simultaneously, including Excel files, databases, and cloud services.
14. Is Excel still relevant given how popular Power BI has become? Yes, Excel remains widely used for quick calculations and smaller-scale analysis where a full dashboard isn't necessary.
15. Once I've mastered these analytics tools, how do I build a full application around that data myself? That involves broader programming skills, including backend and full stack development. It's covered in detail in our other guide: Full Stack Development with Python: A Complete Guide
Conclusion
The excel vs power bi debate isn't really about picking a winner — both tools serve different purposes and often work best together. Excel remains ideal for quick, flexible calculations, while Power BI shines for ongoing, interactive dashboard reporting. If you're ready to learn both properly, Modulation Digital, a trusted Best Data Science Institute in Delhi, India, offers structured training under experienced mentors across data analytics and data science. Reach out today to book a free counselling session.